I’ve been watching the 2017 Gophercon videos from here. There are many good talks that I would recommend watching from that list.
One that I really wanted to try out on my own was the profiling presentation that Peter Bourgon did. I assume for the sake of simplicity, he left some details out. I’ve been trying to figure them out on my own.
I was inspired to try to profile my own Golang web apps using the method he presented in his talk. So in this post I’ll show you a simplified example of how to profile your own web applications in more detail.
The web app
To see a practical example of profiling and to keep it simple, we need to create a web app that when called on a particular route, performs some sort of calculation and returns a result in it’s payload.
If we were to mimic real life scenarios, we would be here all day. So just to keep it simple, we will create a single route that calculates the 25th Fibonacci number when it’s called and returns it in the response body.
I’ve written two versions of the Fibonacci function before hand, one that performs recursion (exponential time – very CPU intensive) and one that calculates the number using a vector (linear time – not very CPU intensive).
In order to use the profiling tool, you need to import the net/http/pprof package and register some routes. In the presentation I mentioned earlier, the speaker mentioned that we could leave this imported even in production environments since it does not affect performance.
package main

import (
	"fmt"
	"log"
	"net/http"
	"net/http/pprof"
)

// O(n) Fibonacci
func linearFibonacci(n int) int {
	// Create an int array of size n + 1
	v := make([]int, n+1)

	// F(0) = 0
	v[0] = 0
	// F(1) = 1
	v[1] = 1

	// F(i) = F(i-1) + F(i-2)
	for i := 2; i <= n; i++ {
		v[i] = v[i-1] + v[i-2]
	}

	// F(n) - return the n-th Fibonacci number
	return v[n]
}

// O(2^n) Fibonacci
func exponentialFibonacci(n int) int {
	// F(0) = 0
	if n == 0 {
		return 0
	}

	// F(1) = 1
	if n == 1 {
		return 1
	}

	// F(n) = F(n-1) + F(n-2) - return the n-th Fibonacci number
	return exponentialFibonacci(n-1) + exponentialFibonacci(n-2)
}

// HTTP request handler
func handler(w http.ResponseWriter, r *http.Request) {
	// return the 25th Fibonacci number in the response payload
	fmt.Fprintf(w, "%d", exponentialFibonacci(25))
}

func main() {
	// Create a new HTTP multiplexer
	mux := http.NewServeMux()

	// Register our handler for the / route
	mux.HandleFunc("/", handler)

	// Add the pprof routes
	mux.HandleFunc("/debug/pprof/", pprof.Index)
	mux.HandleFunc("/debug/pprof/cmdline", pprof.Cmdline)
	mux.HandleFunc("/debug/pprof/profile", pprof.Profile)
	mux.HandleFunc("/debug/pprof/symbol", pprof.Symbol)
	mux.HandleFunc("/debug/pprof/trace", pprof.Trace)

	mux.Handle("/debug/pprof/block", pprof.Handler("block"))
	mux.Handle("/debug/pprof/goroutine", pprof.Handler("goroutine"))
	mux.Handle("/debug/pprof/heap", pprof.Handler("heap"))
	mux.Handle("/debug/pprof/threadcreate", pprof.Handler("threadcreate"))

	// Start listening on port 8080
	if err := http.ListenAndServe(":8080", mux); err != nil {
		log.Fatal(fmt.Sprintf("Error when starting or running http server: %v", err))
	}
}
As you can see, this is a really simple application, save it to a file called main.go and build it like this: go build -o myserver main.go .
Now you can run your binary: ./myserver and to check if it’s working we’ll send a request to it:
$ curl http://localhost:8080
75025
The CPU profile
Now, while the server is running, you will need to run two commands in parallel. You first need to start the profiling tool which will record data for 30 seconds after it is run AND as it is running, run the Apache Benchmark tool to send a few requests it’s way.
So you will need to run the profiling tool like this:
go tool pprof -seconds 30 myserver http://localhost:8080/debug/pprof/profile
While that’s running, run the benchmark:
ab -k -c 8 -n 100000 “http://127.0.0.1:8080/”
This will create a total of 100,000 keep-alive requests to your server, using 8 cores. To better understand what this benchmark command does, it is explained in the link provided.
After 30 seconds, the profiling tool will show a prompt for commands that will look something like this:
$ go tool pprof -seconds 30 myserver http://localhost:8080/debug/pprof/profile
Fetching profile from http://localhost:8080/debug/pprof/profile?seconds=30
Please wait... (30s)
Saved profile in /Users/username/pprof/pprof.myserver.localhost:8080.samples.cpu.013.pb.gz
Entering interactive mode (type "help" for commands)
(pprof)
Here you can run commands to show you how much of CPU time each function took and other useful information. For example, if I run top5 it will list the top 5 functions that are hogging the CPU:
(pprof) top5
84.57s of 85.18s total (99.28%)
Dropped 87 nodes (cum <= 0.43s)
Showing top 5 nodes out of 30 (cum >= 1.09s)
      flat  flat%   sum%        cum   cum%
    51.93s 60.97% 60.97%     51.93s 60.97%  main.exponentialFibonacci
    20.57s 24.15% 85.11%     20.59s 24.17%  fmt.(*pp).doPrintf
    12.06s 14.16% 99.27%     12.06s 14.16%  syscall.Syscall
     0.01s 0.012% 99.28%     11.22s 13.17%  net.(*netFD).Write
         0     0% 99.28%      1.09s  1.28%  bufio.(*Reader).ReadLine
As you can see the exponentialFibonacci function really hogs the CPU.
Please note: These values might differ on your machine. For reference I’m using a MacBook Pro (Retina, 13-inch, Early 2015), 2.7 GHz Intel Core i5 Processor and 8 GB 1867 MHz DDR3 of Memory.
If we wanted to see a graph of this profile we need to run the web command like this:
(pprof) web
(pprof)
This will open up your default browser and display an image of the profile. Here’s a crop of the image that concerns our Fibonacci function:
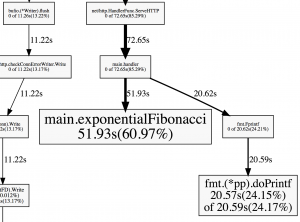
So during that profile, 60.97% of the time, the exponentialFibonacci was running on the CPU.
Optimizations
Now, we know from the theory that O(n) < O(2^n). Let’s see if this holds up in practice, it we were to replace the exponentialFibonacci call with linearFibonacci inside the handler function.
Now we run the profile again. You can immediately see that it took less time because the benchmark actually finishes really fast this time.
If we run top5 now, the linearFibonacci function doesn’t even make the cut. Even if you try to do top100 you will not find it because the compiler inlined that particular code.
So we need to rebuild the application with the compiler flags that disable inlining like this:
go build -gcflags -l -o myserver main.go
Now even with this flag enabled I had a hard time finding the function in the top. I went ahead and increased the hard-coded value for the n-th Fibonacci number to 10,000. So I’m looking for the 10,000th Fibonacci number, this number doesn’t even fit inside the integer datatype in Golang. It will overflow several times before coming to a stop. I also increased the benchmark to 1,000,000 requests.
Now if I run top5 I get:
(pprof) top5
36.21s of 46.49s total (77.89%)
Dropped 226 nodes (cum <= 0.23s)
Showing top 5 nodes out of 102 (cum >= 1.97s)
      flat  flat%   sum%        cum   cum%
    25.94s 55.80% 55.80%     26.23s 56.42%  syscall.Syscall
     3.38s  7.27% 63.07%      3.38s  7.27%  runtime.kevent
     2.60s  5.59% 68.66%      2.60s  5.59%  runtime.usleep
     2.32s  4.99% 73.65%      4.26s  9.16%  main.linearFibonacci
     1.97s  4.24% 77.89%      1.97s  4.24%  runtime.mach_semaphore_signal
Or in graphical format:
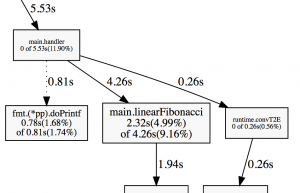
As you can see, it barely even makes a dent.
So for this test, calculating the 25th Fibonacci number recursively takes 60% of the CPU while calculating the 10,000th Fibonacci number linearly takes 4% of the CPU (without inlining).
Another useful command for pprof to see how much CPU time a function takes is the list command. Or, if you’re like me, to find out if a function is actually called.
For our linearFibonacci function it looks like this:
(pprof) list linearFibonacci
Total: 46.49s
ROUTINE ======================== main.linearFibonacci in /Users/username/workspace/go/src/github.com/username/test_profiling/main.go
     2.32s      4.26s (flat, cum)  9.16% of Total
         .          .      8:)
         .          .      9:
         .          .     10:// O(n) Fibonacci
         .          .     11:func linearFibonacci(n int) int {
         .          .     12:	// Create an int array of size n + 1
      10ms      1.95s     13:	v := make([]int, n+1)
         .          .     14:
         .          .     15:	// F(0) = 0
         .          .     16:	v[0] = 0
         .          .     17:	// F(1) = 1
         .          .     18:	v[1] = 1
         .          .     19:
         .          .     20:	// F(i) = F(i-1) + F(i-2)
     260ms      260ms     21:	for i := 2; i <= n; i++ {
     2.05s      2.05s     22:		v[i] = v[i-1] + v[i-2]
         .          .     23:	}
         .          .     24:
         .          .     25:	// F(n) - return the n-th Fibonacci number
         .          .     26:	return v[n]
         .          .     27:}
A better comparison
A better way to compare the two methods, and the theory to practice, is this:
- Knowing that the exponentialFibonacci method is O(2^n), it would take approximately 2^25 = 33554432 instructions to calculate the 25th Fibonacci number.
- Linearly, calculating the 33554432th Fibonacci number should take roughly the same time as calculating the 25th number exponentially.
So following the methodology above we do this:
- Build the application using the exponentialFibonacci(25) call.
- Start the application.
- Start the Apache Benchmark for 1,000,000 requests.
- Start the CPU profile for 30s seconds.
We get this:
(pprof) top5
98.27s of 99.02s total (99.24%)
Dropped 64 nodes (cum <= 0.50s)
Showing top 5 nodes out of 30 (cum >= 1.30s)
      flat  flat%   sum%        cum   cum%
    60.78s 61.38% 61.38%     60.78s 61.38%  main.exponentialFibonacci
    24.54s 24.78% 86.16%     24.54s 24.78%  fmt.(*pp).doPrintf
    12.95s 13.08% 99.24%     12.95s 13.08%  syscall.Syscall
         0     0% 99.24%      1.30s  1.31%  bufio.(*Reader).ReadLine
         0     0% 99.24%      1.30s  1.31%  bufio.(*Reader).ReadSlice
Now for the second part:
- Build the application using the linearFibonacci(33554432) call.
- Start the application.
- Start the Apache Benchmark for 1,000,000 requests.
- Start the CPU profile for 30s seconds.
We get this:
(pprof) top5
49280ms of 49870ms total (98.82%)
Dropped 92 nodes (cum <= 249.35ms)
Showing top 5 nodes out of 29 (cum >= 470ms)
      flat  flat%   sum%        cum   cum%
   28650ms 57.45% 57.45%    44400ms 89.03%  main.linearFibonacci
   15660ms 31.40% 88.85%    15660ms 31.40%  runtime.memclr
    3910ms  7.84% 96.69%     3910ms  7.84%  runtime.usleep
     590ms  1.18% 97.87%      590ms  1.18%  runtime.duffcopy
     470ms  0.94% 98.82%      470ms  0.94%  runtime.mach_semaphore_timedwait
As you can see, the flat percentages, which is how much of the time was spent in the routine itself, is roughly the same. 61.38% vs 57.45%, it’s about 4% difference between them.
Profiling memory
Using the same process, you can run the following command to profile memory:
go tool pprof -alloc_objects myserver http://localhost:8080/debug/pprof/heap
If you run a top command you should see something like this:
(pprof) top10
9741685 of 9927382 total (98.13%)
Dropped 7 nodes (cum <= 49636)
Showing top 10 nodes out of 33 (cum >= 99079)
      flat  flat%   sum%        cum   cum%
   3182489 32.06% 32.06%    3182489 32.06%  net/textproto.(*Reader).ReadMIMEHeader
   2050835 20.66% 52.72%    2050835 20.66%  context.WithCancel
   1068043 10.76% 63.47%    8447075 85.09%  net/http.(*conn).readRequest
    675175  6.80% 70.28%    5155947 51.94%  net/http.readRequest
    667729  6.73% 77.00%     667729  6.73%  net/url.parse
    655370  6.60% 83.60%    1414760 14.25%  main.handler
    618866  6.23% 89.84%     618866  6.23%  main.linearFibonacci
    589833  5.94% 95.78%     589833  5.94%  net/textproto.(*Reader).ReadLine
    134266  1.35% 97.13%     172250  1.74%  net/http.newBufioWriterSize
     99079     1% 98.13%      99079     1%  sync.(*Pool).pinSlow
Conclusion
Now that you’ve seen the basics on how to profile your Golang web apps, you can start diving into heavier stuff like this. Take some time and run a profile on your own Golang web apps.
Also, you should see the Gophercon talk I mentioned at the start of this post, it’s quite good.